
Page 54 - North American Clean Energy March/April 2019 Issue
P. 54
wind power
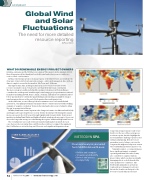
Global Wind
and Solar
Fluctuations
The need for more detailed resource reporting
by Pascal Storck
WHAT DO RENEWABLE ENERGY PROJECT OWNERS
in India, Germany, and the USA have in common? e answer; in the summer of 2018, they all experienced rst-hand just how ckle wind and solar resources can be as a source of fuel – and revenues.
In May, wind energy operators in many regions of the United States saw wind speeds drop up to 20 percent below long-term averages – only to pick up again in June, with an almost complete reversal in key markets, like Texas and Oklahoma.
roughout June, July, and August, European asset owners were a ected by
resource anomalies on an even greater scale than their American counterparts.
e meteorological conditions behind the summer’s heatwave in Western Europe contributed to a widespread ‘wind drought’; wind energy project performance su ered in markets including the UK, France, Spain, Germany, and much of Scandinavia. ese below-par winds were cited in the quarterly nancial reporting of a number of major wind energy producers, at the end of both quarter three and quarter four.
At the same time, as one of Europe’s hottest summers on record curtailed wind generation, solar plant performance in many of these countries increased. is striking example of ‘negative correlation’ between the wind and solar resource helped to ‘plug the gap’ in generation in Europe.
In India, wind farm owners experienced a change in fortune of a di erent kind. In July and August, after a prolonged year-on-year decline in wind speeds (during the annual monsoon season), the 2018 season brought signi cantly stronger winds. In key power markets, including Tamil Nadu and Andhra Pradesh, wind speeds were up to 20 percent above the long-term average recorded during the regions’ traditional high-wind season.
e overall picture across all of these prominent wind markets is mixed. In each case, there are factors at play that could be used as evidence to support the argument that ‘it all balances out in the long run’. However, such signi cant departures from
Clean and analyze your wind farm SCADA data with ease
• Refine and compare • Visualize and identify • Detect and assess
• Comply fully
METEODYN SPA
54
MARCH•APRIL2019 /// www.nacleanenergy.com
long-term averages may not only create doubt over the use of these averages as
a reference point, but also highlight the more immediate challenge operators face in nancial planning. Even if resource anomalies were to balance out over the long run, this might not help asset owners whose individual portfolios may lose out.
Cumulative under- or overperformance has a signi cant impact on annual operating and nancial results. It may also contribute to surprise shifts in project value, which can have potentially damaging e ects on both shareholder value and investor con dence. e burden falls primarily on operations teams and asset managers to present data in the boardroom that gets to the bottom of exactly what factors have
