

2023 Atlantic Hurricane Season Review: Impacts at U.S. east coast offshore projects


Tropical storms and hurricanes pose a unique challenge for offshore wind farm development in the Gulf of Mexico and along the U.S. eastern seaboard. Several collaborative studies are currently underway to understand, model, and quantify the risks of tropical storms to offshore wind farms, including the Tropical and Extratropical Storm Impacts on Future Offshore Winds (TREXO) project led by Argonne National Laboratory.
In this analysis, we will review the 2023 Atlantic hurricane season, focusing on the tropical storms that affected the primary wind development regions along the U.S. east coast, from North Carolina to Massachusetts. Our data sources for wind and wave data are the ECMWF Reanalysis v5 (ERA5) model data set, and measured observational data from five floating LiDAR buoys deployed by TGS sited along the U.S. east coast.
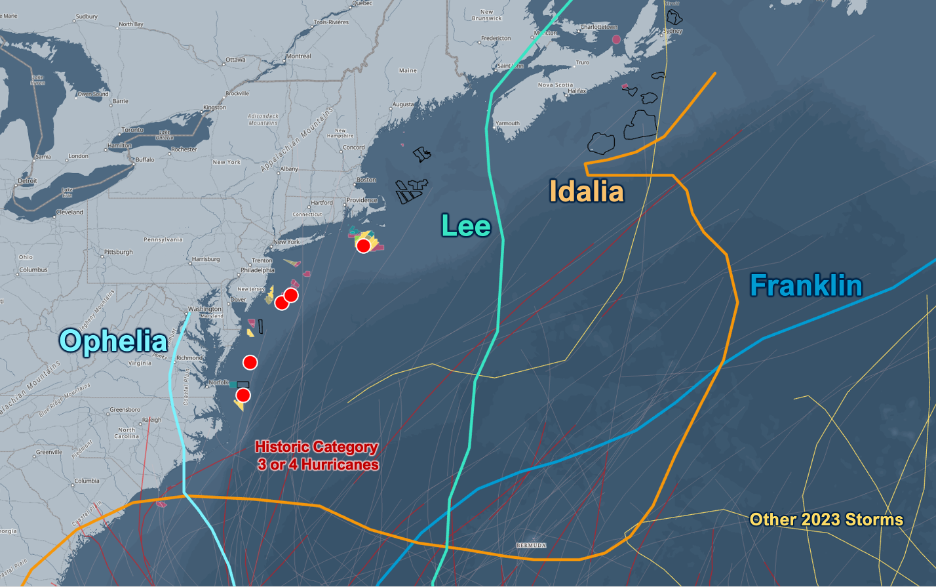
Figure 1. 2023 Atlantic tropical storm tracks. The four named storms that traveled closest to the U.S. east coast are labeled and color coded. Offshore wind lease areas are also shown as colored polygons, and the five floating LiDAR buoy locations are marked as red dots.
2023 Atlantic hurricane season was quite active, producing 20 named storms. Here we focus on the four named storms that traveled closest to the offshore wind development regions along the U.S. east coast: Hurricane Franklin, Hurricane Idalia, Hurricane Lee, and Tropical Storm Ophelia. Figure 1 shows the storm tracks of these four storms, along with the offshore wind lease areas and the locations of the five floating LiDAR buoys.
Hurricane Franklin did not make landfall in the U.S., instead peaking as a Category 4 storm with winds of 150 mph on August 29th. Hurricane Idalia made landfall on the gulf coast of Florida, then crossed over Georgia and South Carolina before reentering the Atlantic Ocean early on August 31st. Hurricane Lee was a long-lived storm, first reaching hurricane strength on September 6th, then making a noticeable turn to the north on September 13th, thereby avoiding the U.S. east coast before making landfall in Nova Scotia on September 16th. And lastly, in contrast, Tropical Storm Ophelia was a short-lived storm sustaining tropical storm-force winds for only two days before making landfall on September 23rd in North Carolina.
Given the timing of these storms, we will review wind speed and wave height data from August 27th through September 25th. Our analysis will focus specifically at the five floating LiDAR buoy locations which are situated close to the primary wind development regions along the U.S. east coast, including the Massachusetts offshore projects, the New York Bight wind farms, and the Central Atlantic wind leases.
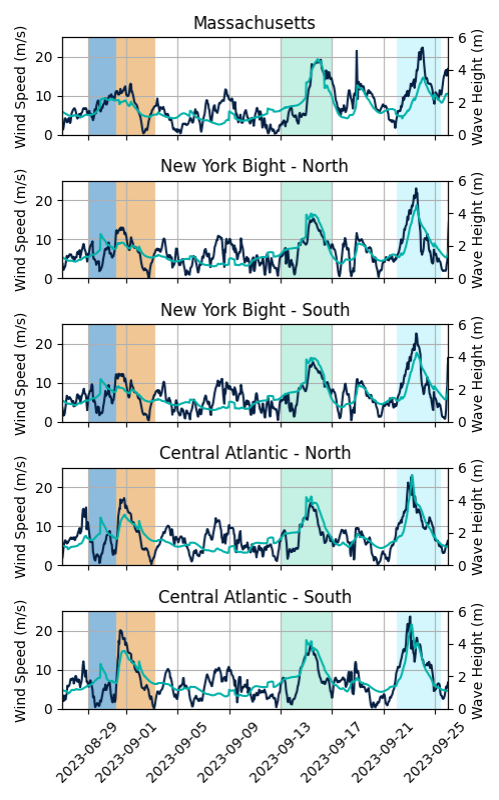
Figure 2. ERA5 wind speed model data (dark blue) at 137m above mean sea level and ERA5 significant wave height (turquoise) model data at each of the five buoy locations. Background color shading denotes the timing of the four named tropical storms during the analysis period: Hurricane Franklin (blue), Hurricane Idalia (orange), Hurricane Lee (green), and Tropical Storm Ophelia (light blue).
Figure 2 displays the modeled ERA5 wind speed and significant wave height data at each of the buoy locations. The background color shading denotes the timing of the four storms where the color corresponds with the storm tracks from Figure 1. Hurricane Franklin only had a minor influence across the five sites, resulting in a small increase in wave heights at the southern buoy locations. Hurricane Idalia had a more noticeable influence at the two southern buoys where wave heights and wind speeds were strong as the storm passed to the south. Farther north, Idalia again did not have much impact. While Hurricane Lee maintained a good distance from the offshore wind projects, the storm persisted long enough to generate strong swells across the region. And stronger winds, close to 20 m/s (45 mph), are also seen at the Massachusetts site as Hurricane Lee passed by to the east. Tropical Storm Ophelia had the largest impact of the 2023 storms. Given the storm track, the strongest wave heights and wind speeds were recorded across the southern Central Atlantic, but positive wind and wave anomalies were felt all the way up to Massachusetts.
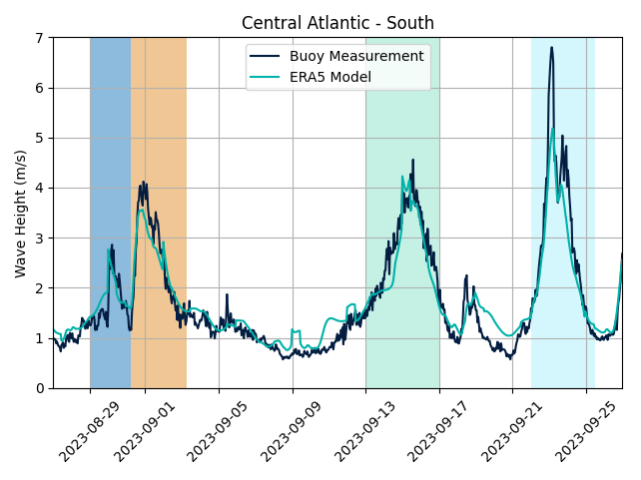
Figure 3. Significant wave height comparison between buoy measurements (dark blue) and ERA5 model data (turquoise) at the southern Central Atlantic buoy. Background color shading denotes the timing of the four named tropical storms during the analysis period: Hurricane Franklin (blue), Hurricane Idalia (orange), Hurricane Lee (green), and Tropical Storm Ophelia (light blue).
The measured data from the five floating LiDAR buoys correlate well with the ERA5 model data and reveal a similar overall picture, but important differences are also apparent. Figure 3 presents a comparison of the measured significant wave height data and the ERA5 model data at the southernmost buoy. This buoy location measured the highest wave heights associated with the 2023 tropical storms. While the timing of the wave height peaks is similar, the ERA5 model data underestimate the maximum wave heights observed during each storm. This is especially true during Tropical Storm Ophelia, when the measured significant wave heights are over 1.5m higher than the ERA5 model data. Additionally, the measured data are much more variable on shorter time scales, which ERA5 does not capture. Such differences can be critically important when calculating the design criteria for wind turbine foundations and engineering loads analysis. Relying on model data, such as ERA5, could lead to significant and very costly errors.
The 2023 Atlantic hurricane season did not produce any storms that directly hit the U.S. east coast offshore wind leases. Tropical Storm Ophelia came closest and had the largest wind and wave anomalies, delivering winds over 25 m/s (55 mph) and significant wave heights near 7 meters (22 feet). The maximum wave height measured during Ophelia exceeded 18 meters (60 feet), which is a good reminder that very large anomalies are possible even during storms that are not rated as hurricanes. Measuring anomalous events is very valuable, and gives engineers real-world data to rely upon in their calculations to ensure the survivability of wind turbines during such extreme conditions.
Scott Eichelberger, PhD, is the Chief Scientist for Offshore Wind, Katie Brennan, PhD, is a Data Scientist, and Phillip Hargreaves is the Ecosystem Program Director for New Energy Solutions at TGS. TGS supports the offshore wind industry by providing access to high-quality wind, metocean, and subsurface data and imaging, in addition to market intelligence and data management platforms.
TGS | tgs.com/wind
Author: Scott Eichelberger, Katie Brennan, and Phillip Hargreaves
Volume: 2024 September/October