


Berkeley Lab’s Latest “Utility-Scale Solar” Report Analyzes Record Deployment in 2023


The newly released 2024 edition of Berkeley Lab’s Utility-Scale Solar report presents analysis of empirical plant-level data from the U.S. fleet of ground-mounted photovoltaic (PV), PV+battery, and concentrating solar-thermal power (CSP) plants with capacities exceeding 5 MWAC. The report explores trends in deployment, technology, capital and operating costs, capacity factors, levelized cost of solar energy (LCOE), power purchase agreement (PPA) prices, wholesale electricity market value, and interconnection queues.
The full report, published in slide-deck format, is accompanied by a narrative executive summary, interactive data visualizations, and a public data file, all available on the project page. The authors will host a free webinar summarizing key findings from the report on Tuesday, October 29, 2024, at 10:00 AM PT/1:00 PM ET. Please register for the webinar here: https://lbnl.zoom.us/webinar/register/WN_yArpXdN8RaiDskswaVErAQ
The following are a few key findings from the latest edition of the report.
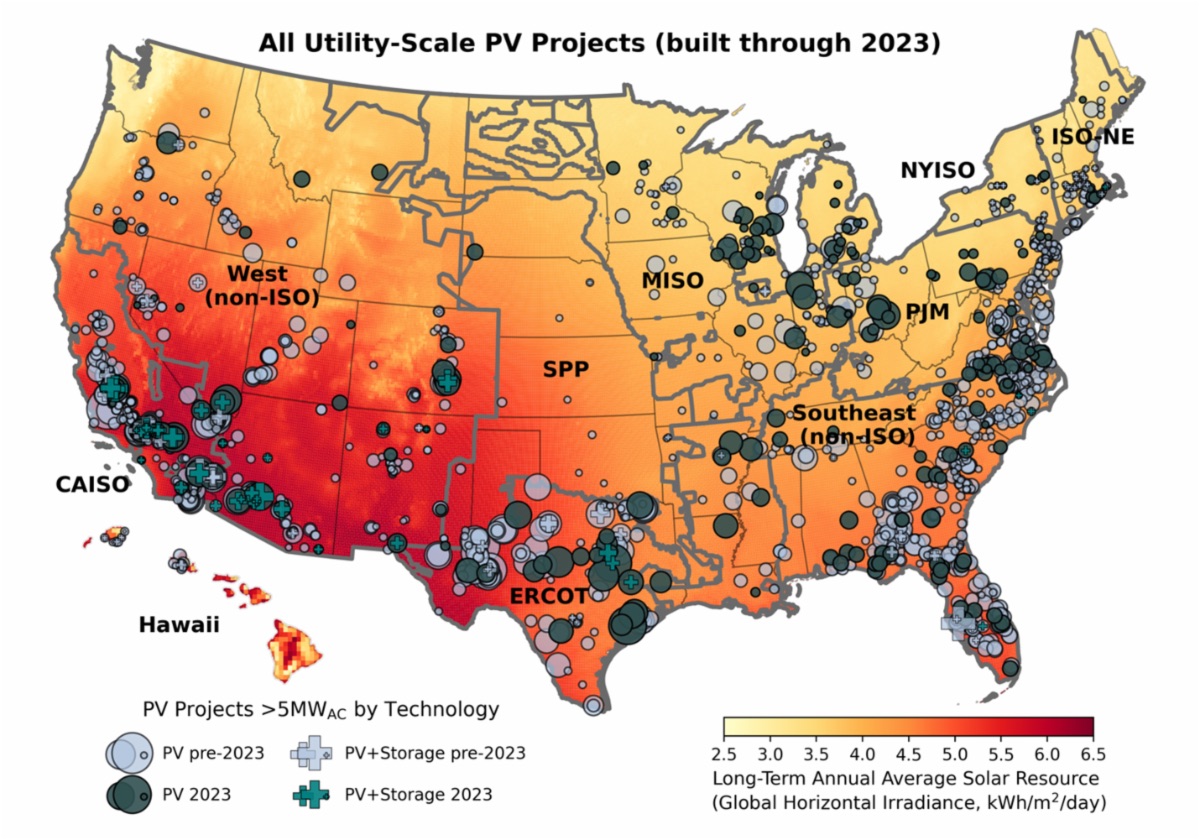
2023 was a record year for utility-scale PV deployment, and the market is becoming increasingly national in scope. 2023’s addition of 18.5 GWAC brought cumulative installed capacity to 80.2 GWAC across 47 states (see map below). ERCOT in Texas added the most new capacity in 2023 (4.2 GWAC), followed by the non-ISO Southeast (3.1 GWAC), PJM (2.8 GWAC), CAISO in California (2.7 GWAC), MISO (2.7 GWAC), and the non-ISO West (2.5 GWAC).
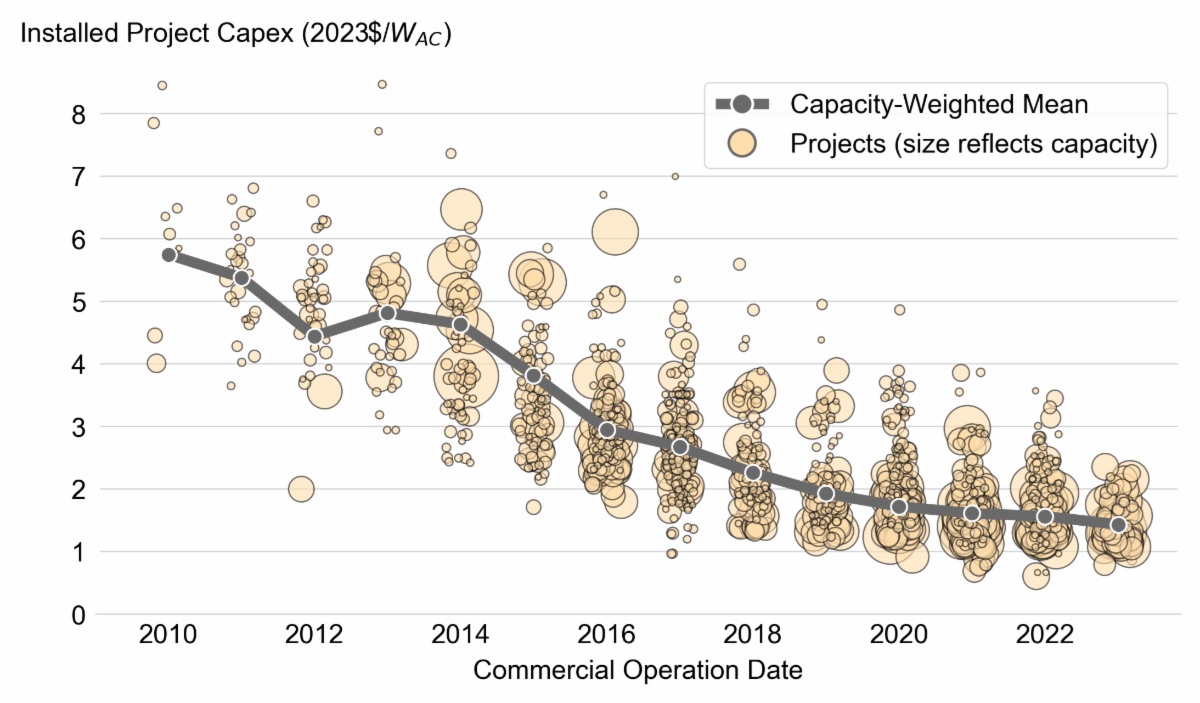
Installed costs continued to fall in 2023. Relative to 2022, capacity-weighted averages decreased by 8% to $1.43/WAC (or $1.08/WDC). Costs, based on a 7.1 GWAC sample of 76 plants completed in 2023, have fallen by 75% (averaging 10% annually) since 2010.
Plant-level capacity factors vary widely, from 7% to 35% (on an AC basis), with a sample median of 24%. The high degree of plant-level variation is driven by many factors, including solar insolation, tracking vs. fixed-tilt mounts, inverter loading ratios, and curtailment. Newer projects show less performance degradation as they age (0.9%/year) compared to older plants (1.47%/year).
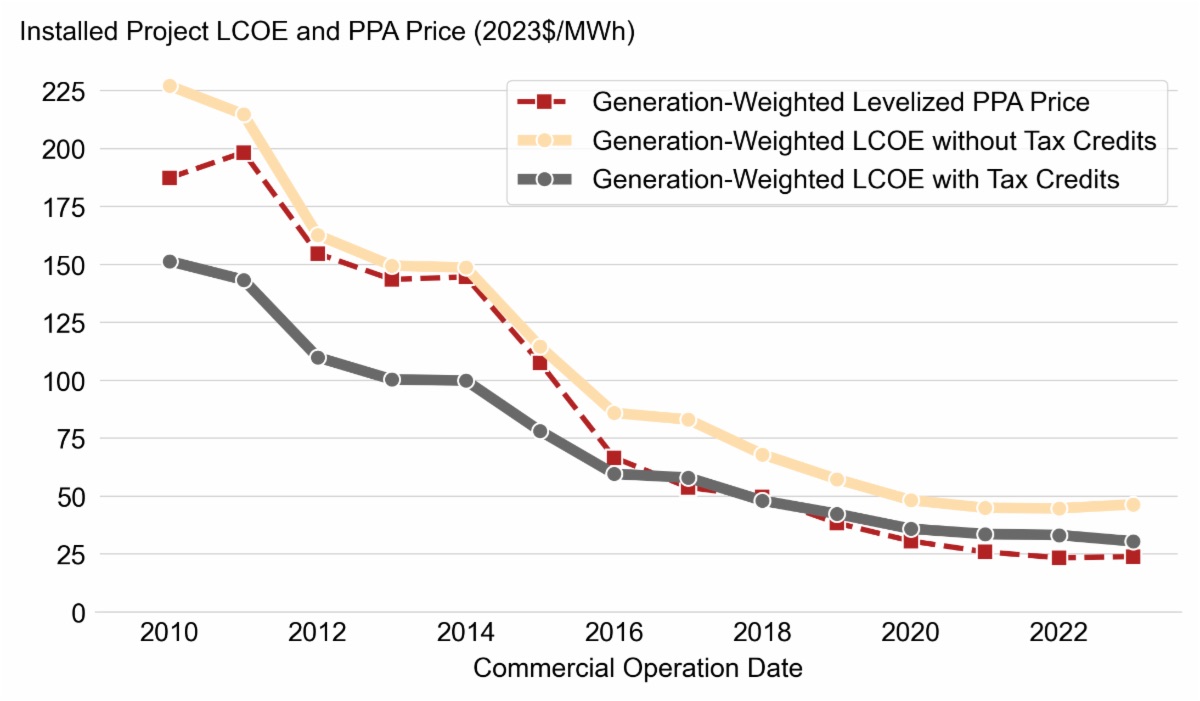
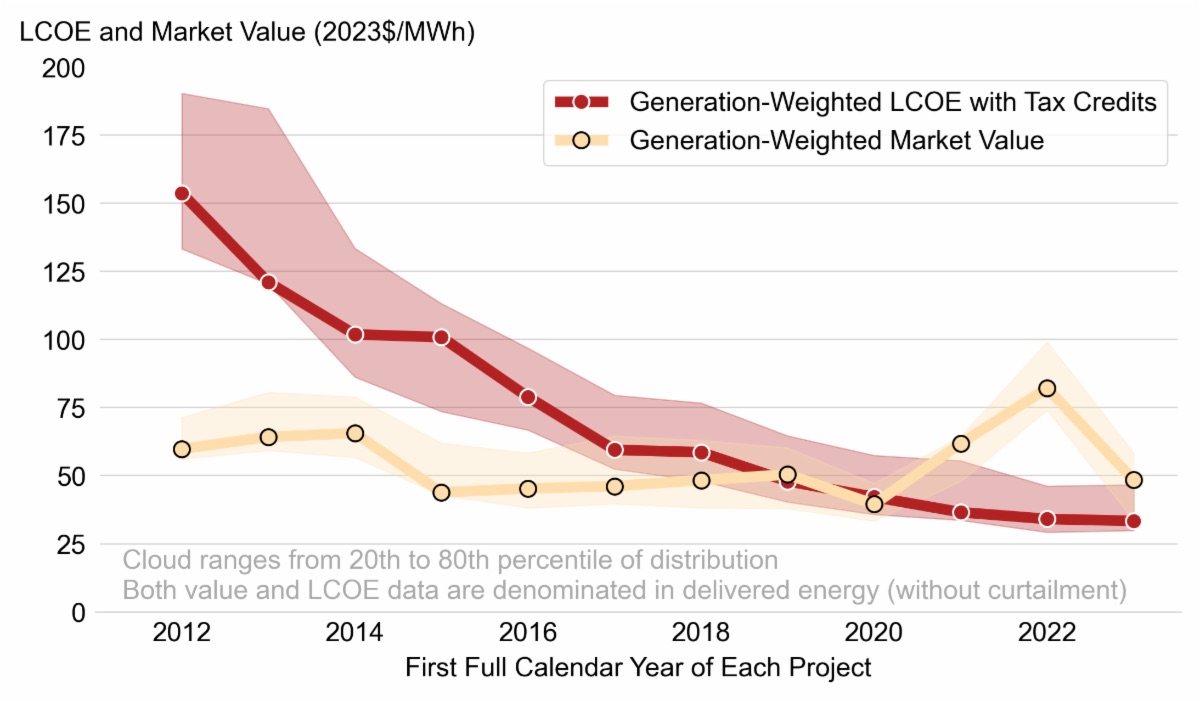
Utility-scale PV’s levelized cost of energy (LCOE) increased slightly to $46/MWh prior to the application of tax credits but continued to fall to $31/MWh when accounting for federal incentives. For most new solar projects, the Production Tax Credit appears more beneficial than the longstanding Investment Tax Credit. Since 2016, Power Purchase Agreement (PPA) prices have closely tracked calculated post-incentive LCOE, suggesting pass through of the credits to purchasers and a competitive PPA market.
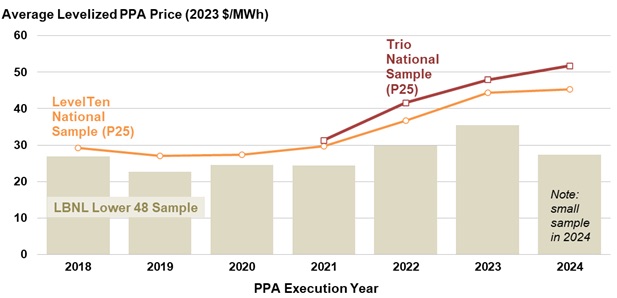
Newly signed longer-term PPA prices have increased since 2021, to an average of $35/MWh (levelized, in 2023 dollars). PPA prices have largely followed the decline in solar’s LCOE over time, but since 2019 have stagnated and even increased among new contracts. (The graph below is by PPA execution year, whereas the graph above is by the year in which a project started operation.) Data from LevelTen Energy and Trio on shorter-term PPAs involving primarily non-utility buyers show an even stronger rise, to $45-$52/MWh.
Solar’s average energy and capacity value (i.e., ability to offset costs of other power generation sources) across the U.S. was $45/MWh in 2023. After high natural gas prices in 2022, solar’s energy value returned to more normal levels of $34/MWh in 2023. Capacity value is greater in the non-ISO regions and can add $30-40/MWh in some Balancing Areas. Solar’s average market value was lowest in CAISO ($27/MWh), the market with the greatest solar generation share, and highest in ERCOT ($67/MWh), driven by summer heat waves and record demand for electricity during solar production hours.
Newer solar projects had greater market value in 2023 than their generation costs, yielding $1.1 billion in benefits. Energy and capacity market value has been greater than levelized generation costs (after tax-credits) for new solar projects since 2020. Projects built in 2022 delivered on average $15/MWh more value than their costs in 2023.
Solar’s combined value from wholesale electricity markets, public health and climate damage reduction were greater than generation costs and incentives, yielding $13.7 billion in net benefits in 2023. Solar offsets fossil generation, reducing health and climate damages. Using avoided emission-rates and damages from the scientific literature and air quality models we estimate U.S. health benefits of $24/MWh and reduced global climate damages of $101/MWh.
Deployment of PV+battery hybrid plants set a record with 5.3 GW installed in 2023.Adding battery storage to shift a portion of excess mid-day solar generation into the evening hours is one way to increase the value of solar. PV+battery hybrid projects are becoming increasingly common, particularly in markets with a higher share of solar generation. In 2023, 52 PV+battery hybrid plants totaling 5.3 GWAC of PV and 3.0 GW / 10.5 GWh of battery storage achieved commercial operations, either as newly built hybrids or storage retrofits to existing solar projects. Most of the new storage capacity was built in CAISO and the non-ISO West.
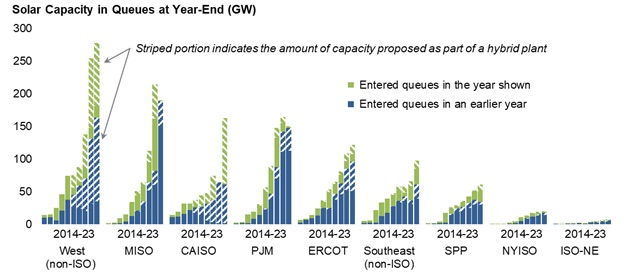
A massive pipeline of more than 1 terawatt of utility-scale solar plants dominates the interconnection queues across the country. Looking ahead, at least 1,085 GW of solar capacity was in the nation’s interconnection queues at the end of 2023. Nearly 571 GW, or 53%, of that total was paired with a battery – in CAISO it was a staggering 98%. Historically only 10% of the requested solar capacity is built, as companies may submit exploratory interconnection requests or may face high interconnection costs or other development challenges.
The full report, published in slide-deck format, is accompanied by a narrative executive summary, interactive data visualizations, and a public data file, all available on the project page.
Lawrence Berkeley National Laboratory | emp.lbl.gov